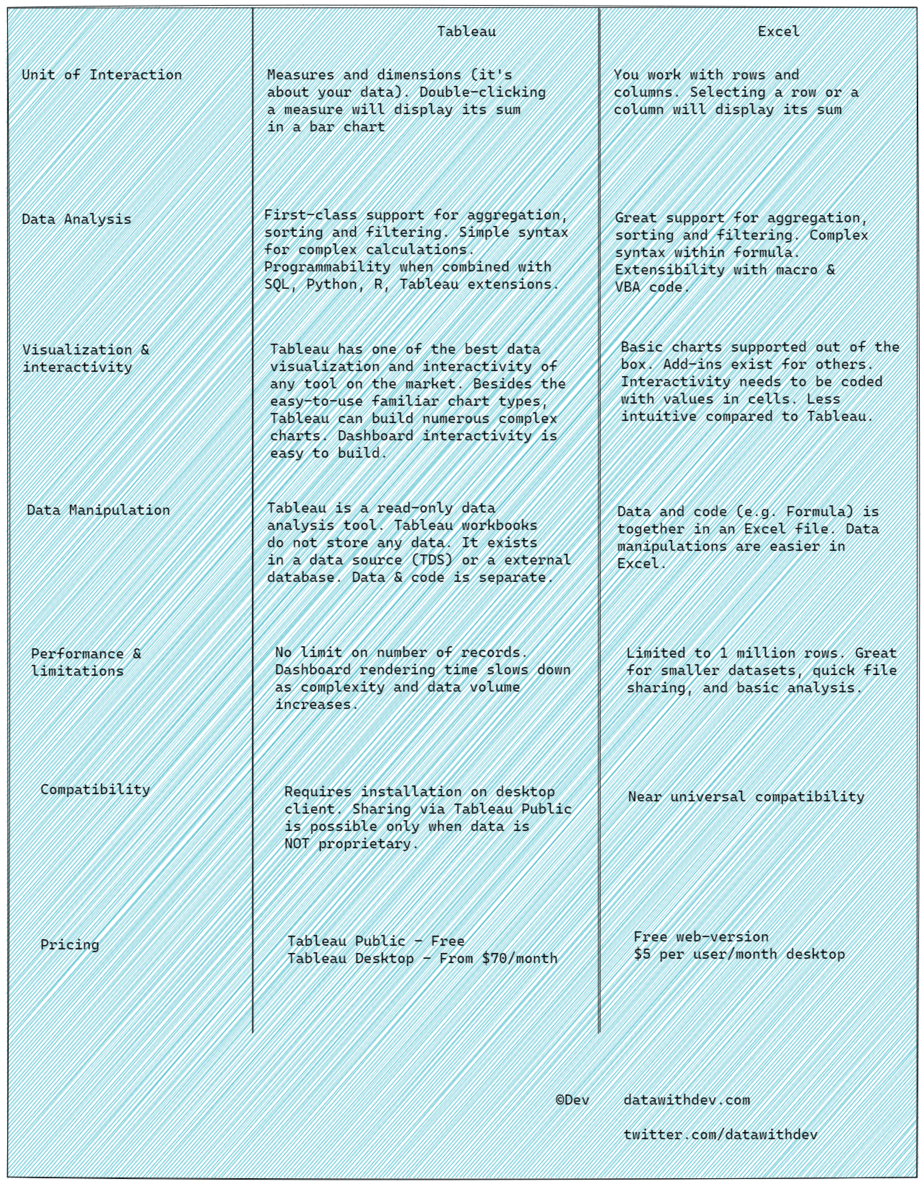
In this article, we will understand how Tableau differs from Excel – the world’s most used Business Intelligence tool. If you are reading this article, chances are, you like Tableau and/or Excel. Both Tableau & Excel are fantastic tools. Comparing the two tools is like comparing a philips screwdriver with a flathead. Both Tableau and Excel are used by data professionals but their use cases have evolved. BI tools like Tableau are preferred in areas where Excel is not the strongest. Creating an Excel is like creating a database in file, something not possible with many BI tools including Tableau. Let dive deeper and understand what are the differences between Tableau & Excel. A high level comparison is included in the following image. We will talk about following things.
- Tableau vs Excel pros and cons
- When to use Excel vs. Tableau (and vice-a-versa)
- The benefits or advantages of Excel over Tableau
- Limitations of Excel and Tableau for specific use cases.
Table of Contents
- How new file creation is different between Excel and Tableau?
- How Tableau and Excel differ in user interaction?
- How charting and visualization differs between Tableau & Excel
- How data manipulation features are different between Excel and Tableau?
- Performance differences between Tableau and Excel
- Pricing and compatibility differences between Tableau and Excel
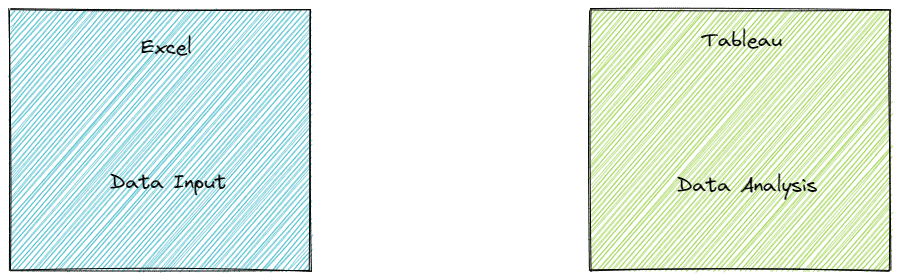
How new file creation is different between Excel and Tableau?
When you open Excel program on your computer and create a new file, what do you see? A blank crosstab with rows and columns. You are ready to enter data into the cells. Excel is a file-based database where you can insert, update, and delete records.
When you open Tableau Desktop and create a new file, what do you see? Ability to connect to a variety of databases including Excel. Tableau has no utility to render data without connecting to a data source. That is, Tableau cannot insert, update, or delete data in its source (I am not counting ability to run a stored procedure or extensions).
The more you internalize this difference between “connect to data” with “create data”, the more apparent the differences become.
How Tableau and Excel differ in user interaction?
When you open an empty Excel file, you see a crosstab of rows and columns. The individual element is called as a cell. In Excel, you work with an individual cell (or a range of cells). When you create a formula for some calculations it is part of the cell. This is a lower level of way of operating on data. For example, let’s say you have a spreadsheet that lists the height of 10 people in your neighborhood in centimeters. You want height in feet. You want to keep height in both units. The height in centimeter exists in column A. You can add height in feet in column B. 1 centimeter equals 0.0328084 in feet. So you can define column B cell 1as:
B1=(A1/0.032808)
The height in feet for next person on row 2, will be calculated using the same formula. The formula is defined at the cell-level. This cell-level computing is part of the reason why large Excel spreadsheets slow down as the number of records approaches 1 million mark. Depending on how many cell-level computations you perform, you can see slowdown even with thousands of records.
In Tableau, after connecting to a data source, you define a data model. In its most basic form, a data model defines dimensions, measures, and their respective data types. Continuing with our 10 people dataset, this could be their names, height, address etc. These attributes will also a specific data type. For example, height_in_cm can be a decimal or a floating point data type. You can create an attribute which is defined using a calculation. For example,
height_in_feet = 0.0328084 * height_in_cm
You can create tens or hundreds of metrics. You can save these metrics in “a data source.” This is equivalent to creating a column in an spreadsheet with a formula which is available for use across all other spreadsheet. That is called as reusability. In programming parlance, it is called DRY – do not repeat yourself.
How data analysis is different between Tableau & Excel
Essentials of data analysis is the operations like aggregation, filtering, and sorting on large datasets. Keep in mind “large” is a relative term. Excel is limited to 1 million rows as of year 2021. Both Excel and Tableau offer fantastic support for basic data analysis operations.
If you wish to write a complex formula, you can do that in both the tools. It is easier to write reusable formula using dimensions and measures in Tableau. Resource library is the closest equivalent in Excel for a reusable formula. If you wish go beyond and run algorithms both tools offer that ability. In Excel, you can use VBA programming. In Tableau, you can integrate with R or Python.
How charting and visualization differs between Tableau & Excel
Charting in Excel is done by selecting a pre-defined chart template. Excel has a large library of chart types which can often be extended with add-ins.
Tableau is no slouch at charting either. Similar to Excel, it offers many chart types. What differentiates Tableau from Excel and many other tools is the powerful visualization language that is not tied to a specific chart types. This makes it possible to build unique charts and their combination (e.g. small multiple).
Once a chart is built, users to want to interact with it, click on an element, drill-down into the data, filter etc. Building this interactivity is very easy in Tableau.
How data manipulation features are different between Excel and Tableau?
Data manipulation means ability to manipulate or change data. This includes operations like insert, update or delete. In a majority of use cases, data is often modified by what is know as a transactional system. Examples of transactional systems are: eCommerce website, billing systems, electronic medical records etc.
As soon as you start modifying data, a different set of data management problems need to be dealt with. Let us say you have downloaded John Doe’s medical insurance claim history in Excel and are presenting this information to your manager. The patient in question complained that he has been billed more than he expected. The data was downloaded from a web-based insurance claim portal. You notice that one of the amount is incorrect. Since the data can be updated in Excel, you highlight the record, update the value, and present your findings to your manager. However, you forget to notify information billing system team to update the record on their end. A few weeks later, the customer is sent a collection notice.
You see the problem here? The billing system is the system of record for all billing data not the excel file. It is OK to change data in Excel for quick report but the updates need to be applied in the system of record.
A Tableau dashboard or a data source is a reflection of the data in the source system, this data synchronization problem is avoided.
Performance differences between Tableau and Excel
By performance, we refer to the responsiveness of the tool to user interactions. The performance is highly dependent on a variety of factors. Row-count, complexity of formula, aggregations, conditions, etc.
Performance degrades as the volume of data grows and as the number of computations increase. Computers are faster at performing numerical operations compared to string operations like match pattern.
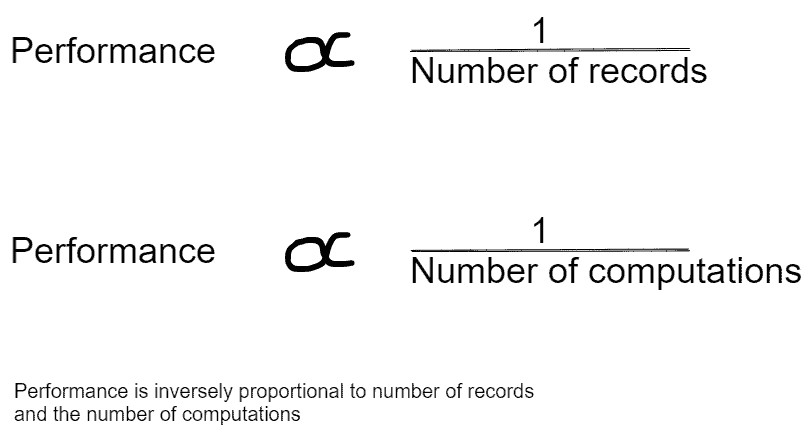
Irrespective of the complexity of operations, Excel has a maximum row-length limit of 1 million records. Tableau can perform operations on billions of records. Note the last statement. Performing operations on billions of records is not the same as displaying of billions of records in a chart. Almost all charting tools will crash if you attempt to display billions of data points on the user interface. A summary of the billions is the recommended approach.
Pricing and compatibility differences between Tableau and Excel
Both Tableau and Excel have a free version. The free version of Excel is web-based. The web version is also limited to 50MB. The free version of Tableau is called Tableau Public. You can only connect to CSV/Excel files using the free version and you must save your workbooks to Tableau Public cloud.
In terms of combability, Excel has near universal compatibility. All modern web browsers and email clients can open an Excel files. This is not the case with a Tableau workbook.
To open Tableau workbooks on a desktop or a tablet, you need to install Tableau client program. Workbooks hosted in Tableau Public (the free version) or those located on a Tableau Server (the most expensive offering for Enterprises) can be opened using a web browser.